http://stockcharts.com/def/servlet/SC.web?c=DD,uu[w,a]dacayiay[dc][pb50!b28!f][vc60][iLp6,3,3!Lo29]&pref=G
Monday, July 11, 2005
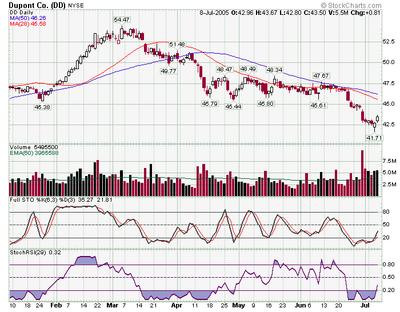
Chart of the day: DD
Subscribe to:
Post Comments (Atom)

For those of you who have inquired, the "Yi" is my own proprietary overbought/oversold indicator. A +10 reading generally indicates we are overbought in the overall market, and -4 or a -5 reading is telling us the market is a bit oversold. The "zero line" in between the plus and minus readings will sometimes act as an area of support or resistance, so I tend to keep an eye on that level also. A reading of +20 is extremely overbought, and a -10 indicates the market is extremely oversold.

http://stockcharts.com/def/servlet/SC.web?c=DD,uu[w,a]dacayiay[dc][pb50!b28!f][vc60][iLp6,3,3!Lo29]&pref=G

No comments:
Post a Comment